3 min read
Auto Insights – The latest “Blank Canvas Syndrome” weapon
Recently, Oracle Analytics introduced a new feature called Auto Insights which comes in addition to the Explain feature-capability, complementing it by delivering a wider scope of insights about a whole dataset to the end-user. The Explain feature has enabled users to get some insights generated automatically within the context of their dataset. Auto Insights is not a replacement for the Explain feature but a complementary new capability sitting alongside the Explain feature. Auto Insights works on the entire dataset whilst Explain focuses on a specific attribute or measure.
We’ll now take a look at Oracle’s latest weapon in its arsenal to combat the dreaded Black Canvas Syndrome.
This feature is currently available for file-based (Excel, csv) and Oracle (on-premises, ADW, ATP) data sources, that’s at the time of writing this blog. Auto Insights automatically scans through newly created data sets and detects patterns and correlations using complex statistical analysis to determine which columns in the data set to use in creating several visualisations.
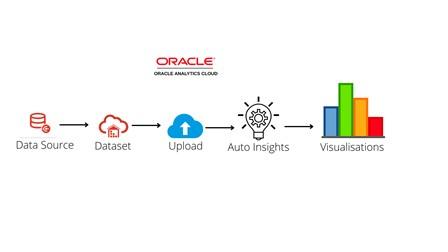
The visualisations selected are then dependent on the column combinations and the contrast they show when visualized in various charts. In some scenarios, the Auto Insights generation process creates new calculations like ratios for example which are used in the visualisations that the process creates.
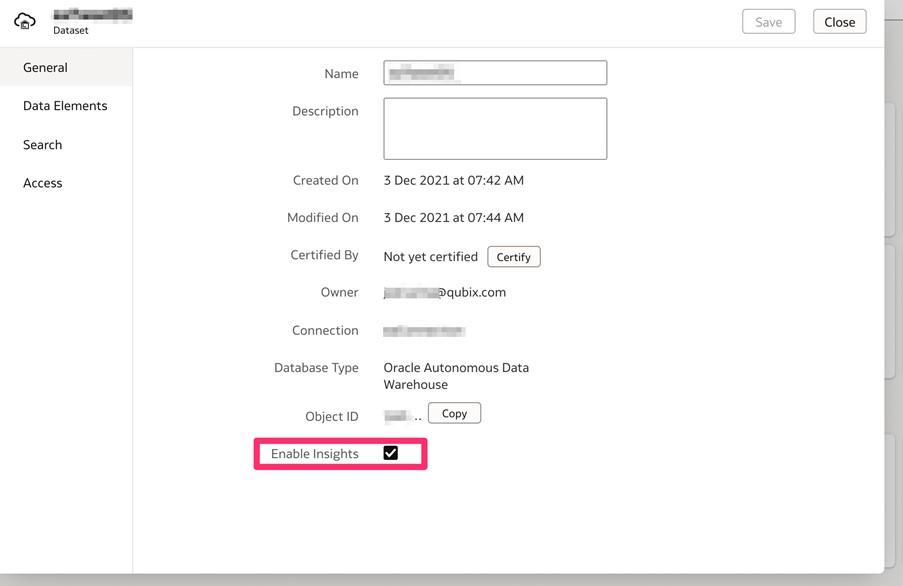
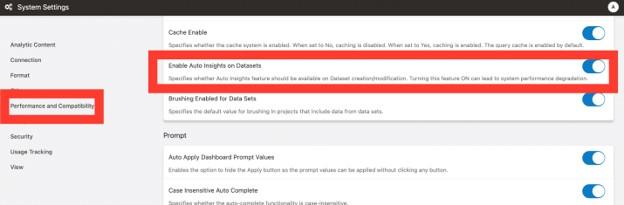
For it to operate, Auto Insights needs to be enabled at the environment level (system settings flag that can be turned on by the Administrator). It then can also be turned on or off at each data set level, so users can turn it off for datasets where they don’t need that type of discovery help.
This is enabled on the dataset from the inspect window by checking the Enable Insights flag. Legacy Auto Insights capable datasets created before this feature release (pre 6.4) have this disabled by default. New datasets will have this flag enabled by default.
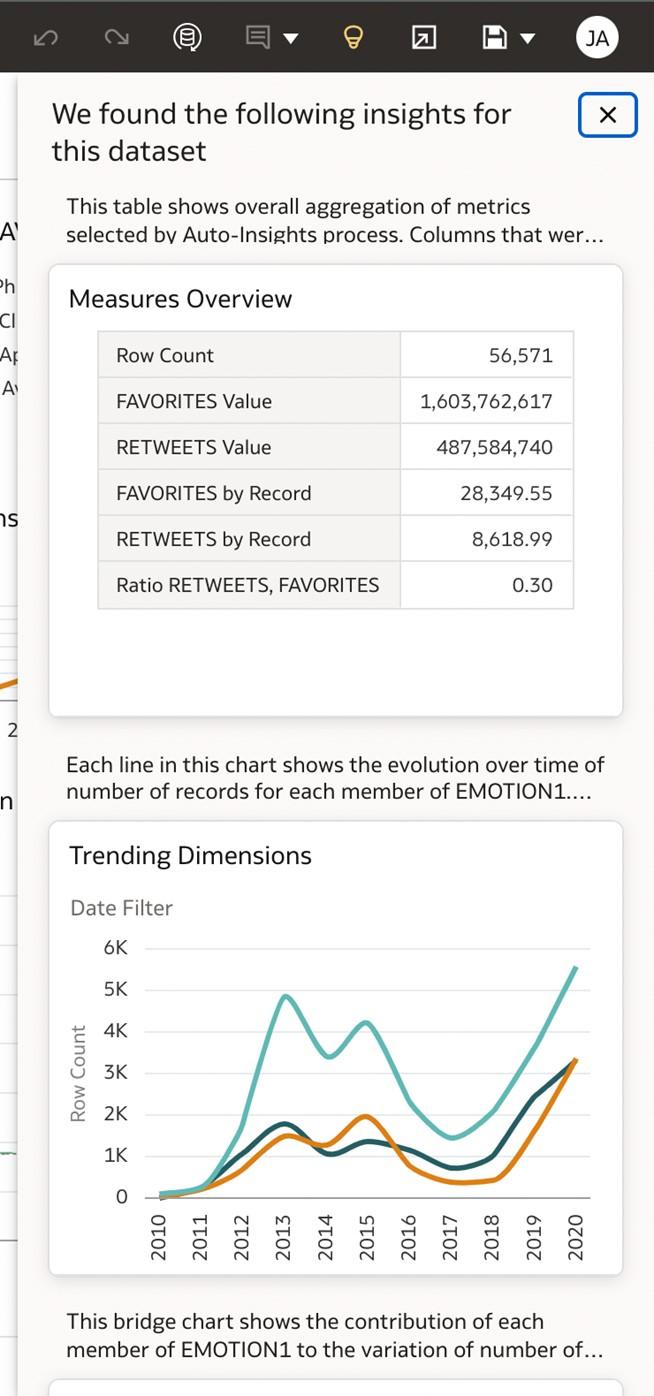
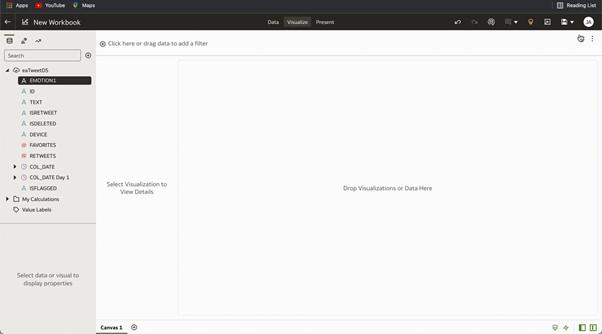
As visualisations are generated for a given dataset, then the icon highlighted below in the worksheet window will be yellow in colour.

Clicking on the icon displays the visualizations that have been generated by the Auto Insights process.
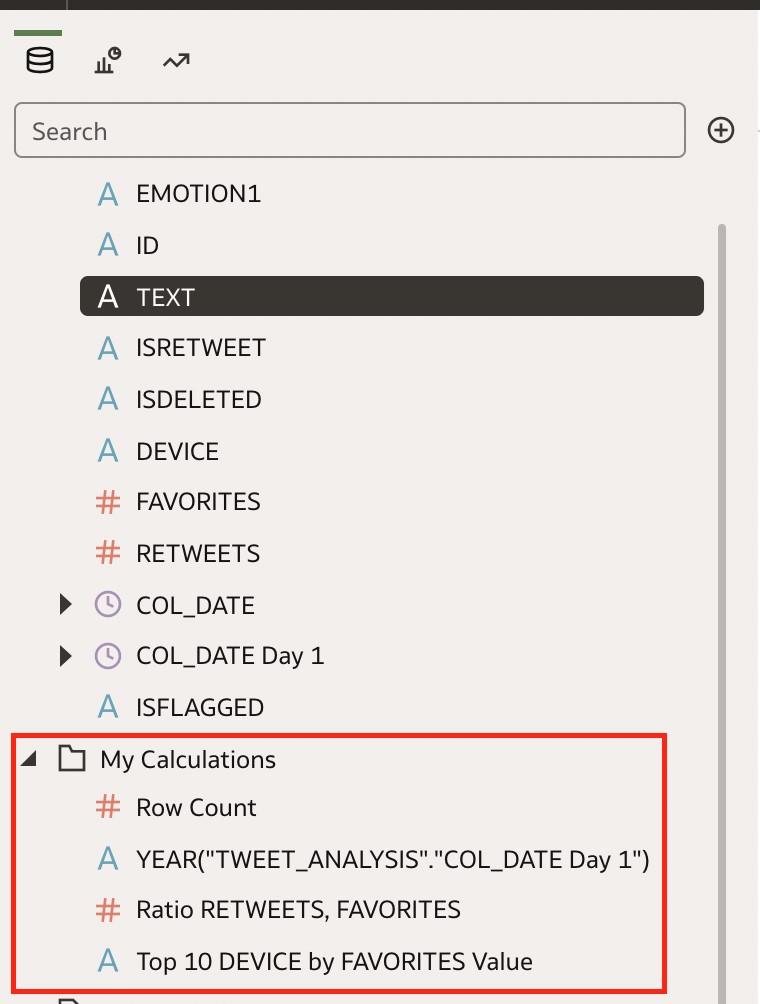
These visualisations can easily be selected and added to your workbook if required and will become standard visualisations within your workbook. Calculations needed to generate these insights are also automatically added to your workbooks, allowing users to understand the full design of the insights.
This feature can be switched on or off at a system level by accessing the System Settings Console. This is switched off by default but in a future release, it will be switched on by default.
Caveats
As mentioned previously, Auto Insights only works for file-based and Oracle data sources now, not yet for data sourced from subject areas, and not fully supported for other connection-based data sources.
In its current version, the feature will be restricted to datasets that either have less than 75,000,000 cells or less than 100 columns.
Summary
As you can see, Auto Insights is a very powerful feature that has been introduced to the platform further enhancing the self-service offering of the Oracle Analytics platform. Users can now uncover further insights with just a few clicks.